How a seasonal ecommerce store spent 39% more on ads, got 5% fewer sales — and what Google Analytics revealed about where the money actually went.
You know that friend who owns a 2003 sedan with a cracked exhaust, bald tires, and a check engine light that’s been on since 2019? Every month there’s a new repair. New alternator. New brakes. Coolant leak. They keep pouring money in because “it still runs.”And every time you suggest selling it, they say: “But I’ve already spent so much on it.
“That’s what running paid ads to an unprepared website looks like.
You’re not investing in growth. You’re subsidizing a broken system — and every dollar you spend on traffic makes the loss bigger.
This is a story about a seasonal ecommerce store that learned this the hard way. A store that spent $52,000+ on advertising in one season, drove 119,000 sessions to its website from Meta Ads — and got back just 1% of its revenue from that traffic.
The average time on site? 6.7 seconds. Not minutes. Seconds.
The store didn’t have a traffic problem. It had a preparation problem. And the data was screaming about it — but nobody was reading the right report.
The Illusion of Growth
On paper, the season looked busy. Ad spend was up 39%. Inquiries nearly tripled compared to the previous year. The Meta Ads dashboard showed millions of impressions and tens of thousands of conversations started. The media buyer was scaling. The numbers were moving.
But sales? Down 5%. And EBITDA — the actual profit left over after costs — came in at just 43% of the plan.
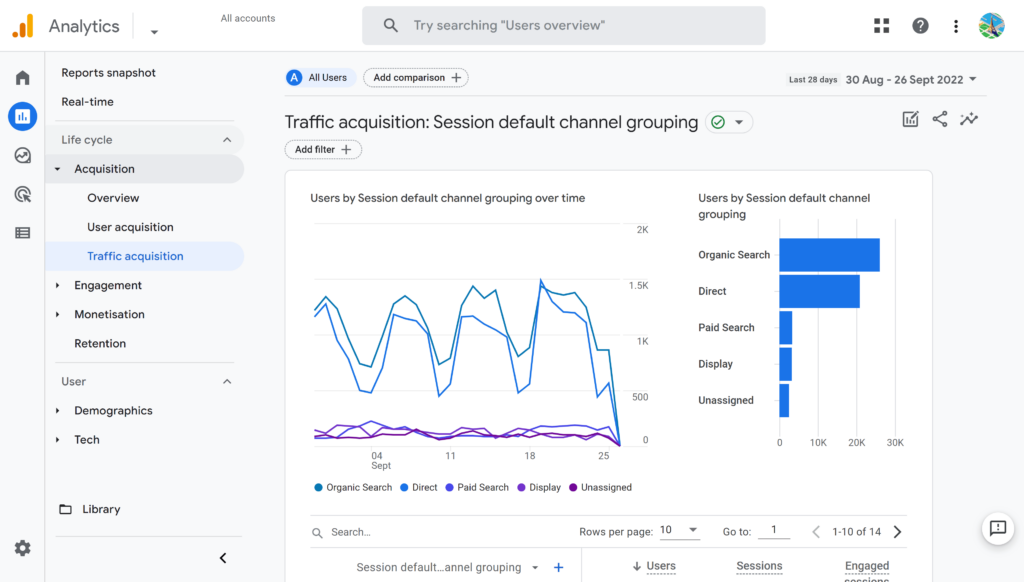
How do you spend significantly more and earn significantly less? The answer was hiding in Google Analytics, in a report most people glance at but never truly interrogate: Traffic Acquisition.
The Traffic Report Nobody Read Properly
Here’s what the data actually said.
In the peak month of December, the website received roughly 121,000 sessions. Sounds great, right? But 102,000 of those — 84% — came from Paid Social (Meta Ads). Those 102,000 sessions generated just 1.6% of the site’s total revenue. The average session duration was 6.7 seconds.
Meanwhile, Organic Search — a channel that contributed just 1,091 sessions — generated 9.8% of revenue with a 33% conversion rate and an average revenue per session of ~$1.60. That’s a 416x difference in revenue efficiency compared to paid traffic.
Organic Social (unpaid Instagram posts and stories) brought 13,800 sessions and delivered 65% of the site’s revenue, converting at nearly 18%.
The website itself was working. Excluding the junk traffic from paid ads, the site’s real conversion rate in December was 18.28% — an excellent number by any ecommerce standard. The checkout flow worked fine. The product pages converted well. The problem wasn’t the car. It was the fuel.
Three Mistakes That Made the Numbers Lie
Mistake #1: Treating all traffic as equal
When you look at a Google Analytics overview, you see “Users” and “Sessions” as aggregate numbers. And when those numbers go up, it feels like progress. But a session that lasts 6 seconds and bounces from the homepage is not the same as a session where someone browses three product pages and adds to cart. Aggregated metrics masked a brutal truth: three-quarters of all traffic was essentially phantom visitors — people who were served an ad inside the Meta in-app browser, landed on the homepage, and left before the page even fully loaded.
Mistake #2: Sending 74% of all site traffic to a page that wasn’t built to convert
Here’s the thing that makes this story painful, not tragic: the paid traffic wasn’t inherently useless. The tiny handful of campaigns that sent visitors to product pages or the catalog converted at 16–19% — perfectly in line with organic channels. The ads could work. The audiences weren’t wrong.
But those campaigns were the exception. The vast majority of paid traffic — 94% of all Meta Ads sessions — landed on the homepage. And the homepage converted at just 2.97%. That’s a 6.5x gap. The homepage was designed for brand storytelling and seasonal mood-setting, not for catching a cold visitor from an ad and turning them into a buyer within seconds. There was no clear path to the catalog. No immediate product visibility. No reason for someone who just tapped an ad to stay.
So 74% of the entire site’s traffic during peak season — over 100,000 sessions — hit a page that functionally acted as a dead end for paid visitors.
Browser data told the same story from a different angle: 67% of site users came through Android WebView (Meta’s in-app browser on Android) and contributed just 8.9% of revenue. Meanwhile, Safari users — largely organic Instagram visitors and direct traffic on iPhones — made up 17% of users but drove 66% of revenue.

Mistake #3: Scaling without a feedback loop
The store’s Meta Conversion API (CAPI) — the server-side tracking that tells Meta which ad clicks actually led to purchases — had disconnected at some point during the season. Less than 1% of purchase data was being sent back to Meta. This meant the ad platform had almost no signal about what was working. It was optimizing in the dark. At the same time, 16 new ad creatives were launched in December (the peak month), when the proven strategy should have been to scale what already worked, not to experiment. The result: average cost per lead on new creatives was $1.86 vs. $0.99 on the best-performing (but under-funded) Instagram Post format.
The Real Cost of “Let’s Just Drive More Traffic”
The Meta Ads traffic to the website cost roughly $9,100. It generated roughly $275 in revenue. After accounting for ad costs and margins, this channel produced a net loss of approximately $8,800.
That’s not a rounding error. That’s a full campaign budget, lit on fire, because the destination — the website — wasn’t prepared to receive that traffic in a way that could convert.
Meanwhile, ad spend as a percentage of revenue ballooned to 29% in December against a planned 18%. The extra spend didn’t buy growth. It bought noise.
What Should Have Happened Instead
The fix wasn’t complicated. It was sequential. The store needed to prepare the infrastructure before turning on the traffic hose:
Before the season: set up server-side tracking (CAPI) so Meta could actually learn which clicks convert. Build a GA4 dashboard that separates paid from organic performance. Prepare the homepage for ad traffic — or, better yet, build dedicated landing flows that send paid visitors straight to catalog or product pages where they can act. The data proved those pages convert. The homepage didn’t.
During early season: run creative tests in October–November when stakes are lower. Identify the top 2–3 performers. Cut everything else.
During peak: scale only proven creatives. Protect the best-performing ad formats from budget cuts. Monitor cost per lead daily with a hard ceiling. If a campaign crosses the threshold — turn it off, don’t hope it recovers.
The whole time: make sure someone is reading the right analytics report. Not just the Meta dashboard (which shows what Meta wants you to see), but the GA4 Traffic Acquisition report that shows what actually happens after the click.

The Takeaway for Every Seasonal Business
If your business depends on a 2–4 month sales window — whether you sell Christmas trees, outdoor furniture, school supplies, or winter coats — the temptation is always the same: spend more on ads when peak season arrives, because there’s no time to waste.
But spending more on traffic to a site that isn’t ready to convert is like revving a broken engine harder. You burn fuel faster, the engine overheats, and you end up on the side of the road wondering what happened.
The site is the engine. Ads are the fuel. Fix the engine first.
That means your analytics need to be working before the first ad dollar is spent. Your landing pages need to be tested and ready before you scale. Your tracking infrastructure — CAPI, UTM tags, GA4 goals — needs to be verified before you trust the data enough to make budget decisions on it.
The store in this case study didn’t have a bad product. The margins were healthy. The checkout worked. Organic traffic converted beautifully. The site was a good car — it just needed new tires, a working dashboard, and someone to stop filling it with the wrong fuel.
The season was a lesson, not a failure. And if you recognize any of this in your own business, it might be the most valuable one you’ll read this year.
This post is based on a real ecommerce audit conducted by Zerna Tech in early 2026. Some figures have been rounded for readability. If your seasonal business is approaching its peak and you’re not sure whether your site is ready for the traffic you’re about to buy — that’s exactly the kind of problem we help solve.